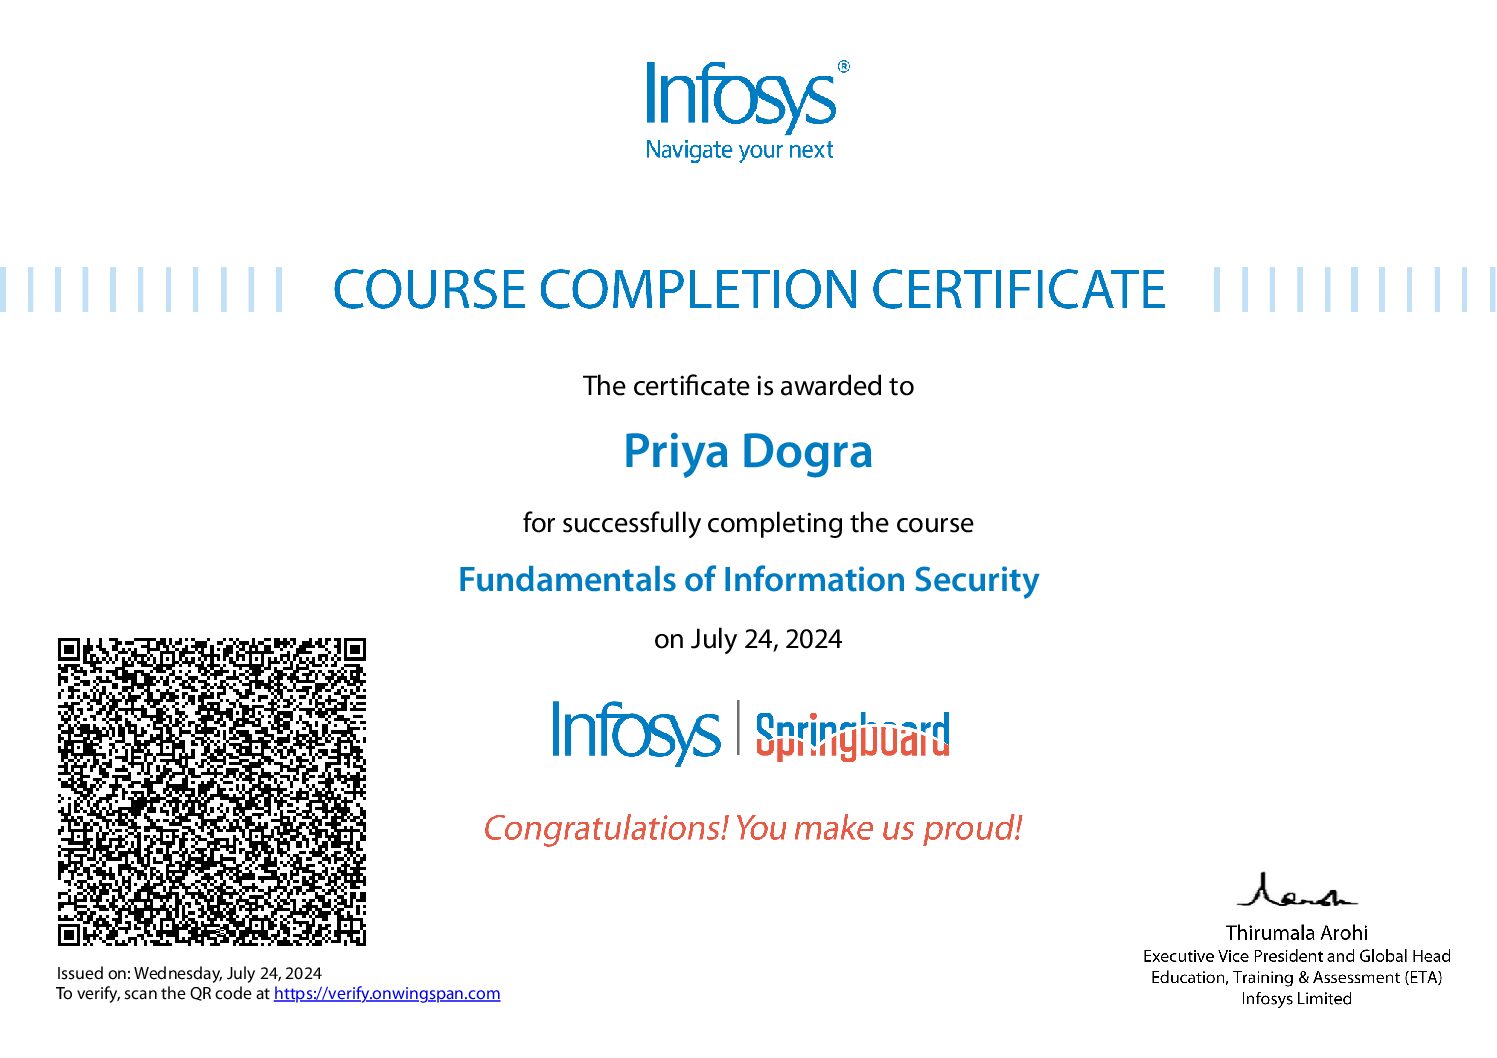
Data Visualization with Python using Matplotlib Free Course | Free Certificate
In this course you will get complete information about Data Visualization with Python using Matplotlib. This course will guide you through all the possible techniques that are used to visualize data using the Matplotlib Python library. Find Out the Complete Curriculum Here:
Learning Objectives
- Learn the fundamentals of Python’s Matplotlib library and its main features
- Customize objects in Matplotlib
- Create multiple plots in Matplotlib
- Customize plots in Matplotlib (annotations, labels, linestyles, colors, etc)
- Understand the different plot types available
Here is the complete curriculum:
Section 1: Introduction to Matplotlib
- What Is Python Matplotlib?
- Plot a Line Plot Using Matplotlib
- Plot a Bar Plot Using Matplotlib
- Plot a Pie Chart using Matplotlib
- Plot Scatter Plot Using Matplotlib
- Plot a Stack Plot using Matplotlib
- Plot a Histogram Plot using Matplotlib
- Plot a Sub Plot in Matplotlib
- Quandl API to Plot Real Time Stock Data
Section 2 includes Quiz containing total of Questions 5 and you need to achieve an 80% Passing Score. A question may have multiple correct options. You have to mark all the correct options for your answer to be considered correct.
Here are the questions and answers:
1) Which is a python package used for 2D graphics?
– matplotlib.pyplot.
2) Identify the package manager for Python packages, or modules.
– PIP.
3) Identify the right type of chart using the following hints.
Hint 1: This chart is often used to visualize a trend in data over intervals of time.
Hint 2: The line in this type of chart is often drawn chronologically.
4) Line Chart The plot method on Series and DataFrame is just a simple wrapper around __
– plt.plot().
5) Point out the correct combination with regards to kind keyword for graph plotting.
– All of the mentioned.
Requirements of the course:
- Python
- Numpy
- Pandas
CLICK HERE TO APPLY
Other Important Courses in this website:
- Python Foundation with Data Structures & Algorithms
- Python for Data Analysis using NumPy
- Using MySQL Databases With Python
- Advanced Computer Vision with OpenCV and Python
Also Check this out:
 Priya Dogra – Certification | Jobs | Internships


