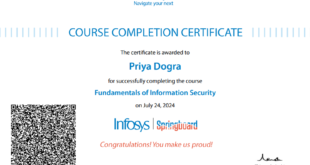
Get Data Visualization with Python Certificate from MachineLearning.org.in which you can share in the Certifications section of your LinkedIn profile, on printed resumes, CVs, or other documents.
Exam Details:
- Format: Multiple Choice Question
- Questions: 10
- Passing Score: 8/10 or 80%
- Language: English
Question 1: What is data visualization?
- It is the graphical representation of information and data
- It is the numerical representation of information and data
- It is the character representation of information and data
- None of the above
Question 2: What is true about data visualization?
- Data Visualization helps users in analyzing a large amount of data in a simpler way
- Data Visualization makes complex data more accessible, understandable, and usable
- Data Visualization is a graphical representation of data
- All of the above
Question 3: Data visualization is also an element of the broader _
- Data process architecture
- Data presentation architecture
- Deliver presentation architecture
- None of the above
Question 4: Data visualization tools provide an accessible way to see and understand __ in data.
- Trends
- Outliers
- Patterns
- All of the above
Question 5: Which method shows hierarchical data in a nested format?
- Treemaps
- Scatter plots
- Area charts
- Population pyramids
Question 6: What are the common types of data visualization?
- Charts
- Tables
- Infographics
- All of the above
Question 7: What are specific examples of methods to visualize data?
- Area Chart
- Bubble Cloud
- Dot Distribution Map
- All of the above
Question 8: Which of the intricate techniques is not used for data visualization?
- Heat Maps
- Fever Maps
- Bullet Graphs
- Bubble Clouds
Question 9: Which of the following lists names of variables in a data.frame?
- par()
- names()
- quantile()
- barchart()
Question 10: _ helps in designing effective tables and charts for data visualization.
- PivotTable
- Data-ink ratio
- Scatter charts
- Crosstabulation
 Priya Dogra – Certification | Jobs | Internships


